
The world's most versatile measuring software package.
The Multi Channel oscilloscope software is designed to work with all TiePie engineering USB measuring instruments. Together with TiePie engineering instruments, it can be used as:
- Oscilloscope
- Spectrum analyzer
- Data logger / Transient recorder
- Multimeter
- Arbitrary Waveform Generator
- Protocol analyzer
Multiple instruments can be combined to form a larger combined instrument, acting as a single instrument with many channels. The software can display this data in an unlimited amount of different displays with very different possibilities on how to display the measured data.
The Multi Channel oscilloscope software offers many measurement templates that help you set your instrument up for almost any measurement application. The templates are selected from a clear and convenient template selection dialog.
The Multi Channel oscilloscope software user interface supports many different languages.
Oscilloscope
An oscilloscope is an instrument to display signal voltages, plotted against time (Yt) or against another signal voltage (XY). A benefit of graphically showing signals is that oscilloscopes will show what is actually happening. The precise shape of the signal and time relations in the signal or between signals can be seen.
Oscilloscopes displays electrical signals, but with the proper sensors, other quantities like temperature, movement, etc. can be measured as well.
A scope has many applications, in many different areas. An important application of oscilloscopes is to troubleshoot circuits that do not function properly. Another possible application is using the lab scope as signal monitor when adjusting a circuit under test.
Features of the Multi Channel software oscilloscope
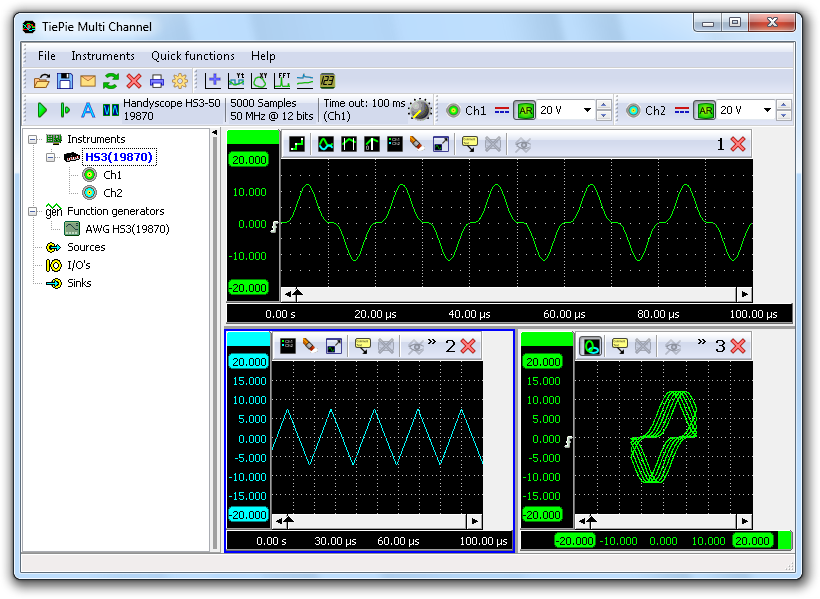
Figure 1: Oscilloscope screen. Click on the different areas to get more information.
The oscilloscope function in the Multi Channel oscilloscope software has the following features:
Oscilloscope graphs
The oscilloscope can have one or more graphs, each displaying one or more signals, where each graph can display different parts of a signal. Graphs can display the signal(s) in Yt mode or in XY mode, with or without interpolation. Colors of all items in a graph can be set to any required value. Graph dimensions can be adjusted to any required size, graphs can be located in one single window or in separate windows, which can be located anywhere on the desktop.
Cursors are available in the oscilloscope to make on screen measurements, as well as a t=0 line to indicate the trigger moment. Signals can be given descriptive names and a legend is available to simplify identifying the displayed signals. Text labels can be placed to mark interesting parts of the signal(s).
To reveal all details of the measured signals, the oscilloscopes offer unlimited zooming in both vertical and horizontal direction. All zoom actions can be undone with an undo zoom function.
Mathematical operations in the oscilloscope
Various mathematical operations can be performed on the measured data. Basic mathematical operations that can be performed in the oscilloscope are:
- Adding/subtracting
- Multiplying/dividing
- Differentiating
- Integrating
- Determining the square root of a signal
- Determining the absolute value of a signal
These operations can be combined in any thinkable way. The result of a mathematical operation can be displayed in a graph and can also be used as input for another mathematical operation.
More complexe mathematical operations that are available are:
- Averaging
- Filtering
- Min/Max detection
- Limitting
- Determining duty cycle
- Resampling data
Storing oscilloscope data
Measurement data can be stored in various different ways:
- Saved to disk in various different data file formats
- Printed, with customizable layout and colours
- Stored as image file, in various common formats
Oscilloscope controls
Controlling the oscilloscope is done through customizable toolbars, through popup menus and by hotkeys. A quick function toolbar is available for often used functions.
Spectrum analyzer
A spectrum analyzer is an instrument that graphically displays signal amplitude against frequency, in the frequency domain. It will show which frequency components are present in a signal and how strong these are.
Not all electrical systems can be characterized properly in the time domain. Circuits like filters, amplifiers, oscillators, mixers, modulators and detectors can be characterized best by their frequency behavior. That frequency behavior is best obtained by observing the electrical signals in the frequency domain. To display the frequency domain, an instrument is needed that can distinguish different frequencies from each other and measure the signal size at the different frequencies. An instrument that can display the frequency domain is the spectrum analyzer.
In the time domain all frequency components of a signal are seen summed together. In the frequency domain, complex signals (signals composed of more than one frequency) are separated into their frequency components, where the amplitude of each component is displayed.
The frequency domain contains information which is not available in the time domain. Therefore the spectrum analyzer has certain advantages compared with an oscilloscope:
- With a spectrum analyzer small harmonic distortions on a signal can be displayed better than on an oscilloscope. A sine wave may look good in the time domain, however in the frequency domain the harmonic distortion is visible.
- A noise signal may look fully random in the time domain on an oscilloscope, in the frequency domain on a spectrum analyzer it can appear that one frequency is dominantly present.
- In the frequency domain it is very simple to determine carrier frequency, modulation frequency, modulation level and modulation distortion from a modulated signal (AM or FM).
Features of the Multi Channel software spectrum analyzer
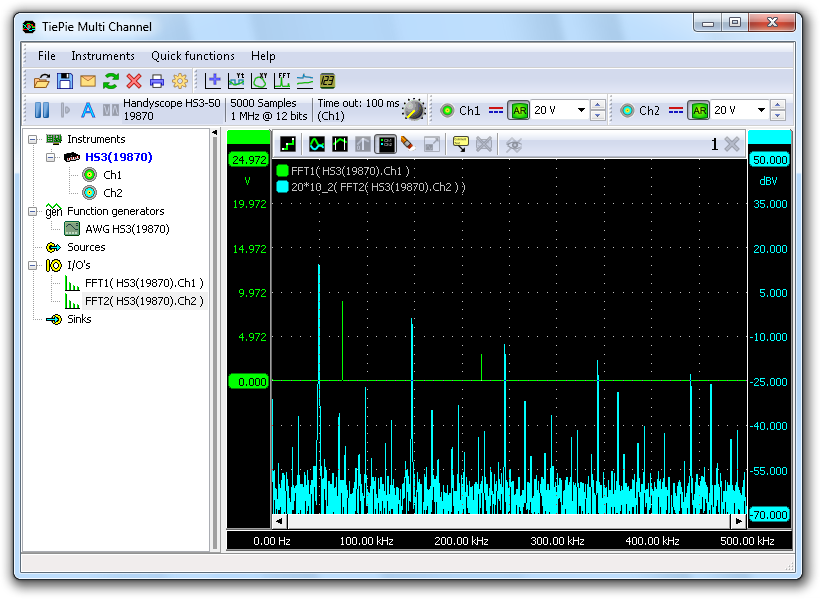
The spectrum analyzer function in the Multi Channel oscilloscope software uses a Fast Fourier Transform to convert the time domain to the frequency domain. Various different windowing functions are available to minimize the effect of spectral leakage.
Spectrum analyzer graphs
The spectrum analyzer can have one or more graphs, each displaying one or more signals, where each graph can display different parts of a signal. Colors of all items in a graph can be set to any required value. Graph dimensions can be adjusted to any required size, graphs can be located in one single window or in separate windows, which can be located anywhere on the desktop.
Axes can be set to linear or logarithmic.
Cursors are available to make on screen measurements, including determining the Total Harmonic Distortion in a signal. Signals can be given descriptive names and a legend is available to simplify identifying the displayed signals. Text labels can be placed to mark interesting parts of the signal(s).
To reveal all details of the measured signals, unlimited zooming is available in both vertical and horizontal direction. All zoom actions can be undone with an undo zoom function.
Mathematical operations in the spectrum analyzer
Mathematical operations can be performed on the measured data:
- Averaging
- Min/Max detection
Storing spectrum analyzer measurement data
Measurement data can be stored in various different ways:
- Saved to disk in various different data file formats
- Printed, with customizable layout and colours
- Stored as image file, in various common formats
Spectrum analyzer controls
Controlling the spectrum analyzer is done through customizable toolbars, through popup menus and by hotkeys. A quick function toolbar is available for often used functions.
Data logger / Transient recorder
A data logger is a direct registering instrument to display signal voltages, plotted against time (Yt) or against another signal voltage (XY).
The data logger will measure in a continuous streaming mode, until it is stopped by the user. While measuring, each time new samples are taken, they will be transferred directly to the computer where they will be processed and displayed and when required stored to disk. Any change in the input signal(s) will be immediately visible. The measurement duration is not limited by the amount of internal memory in the instrument, allowing for very long uninterrupted measurements.
The main difference with the oscilloscope is that the oscilloscope measures a predefined amount of time and stores all measured data internally in the instrument. When all data is measured, all data will be transferred to the computer and then be processed and displayed. After that, a new measurement will be started. This limits the total measuring length to the the size of the available memory inside the instrument. And there will always be a gap between two successive measurements.
The measuring mode of the data logger / transient recorder makes it the ideal instrument for measuring slowly changing signals like e.g. the temperature change in a room. While capturing the whole process, any change on the input signal(s) is immediately visible.
Another application for the data logger is to measure long non-repetitive signals like e.g. a serial communication signal, that would last too long to be captured in the internal memory of the hardware.
Features of the Multi Channel software data logger
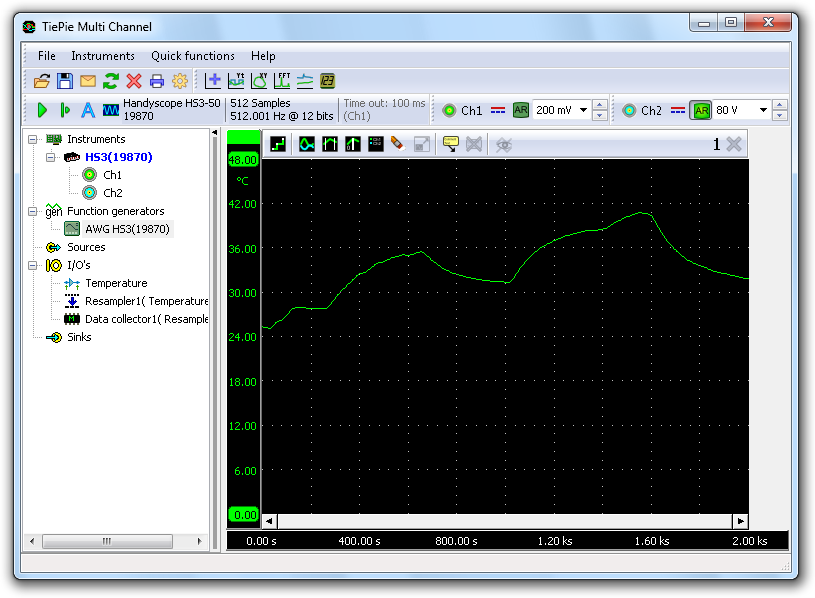
The data logger function in the Multi Channel oscilloscope software has the following features:
Data logger graphs
The data logger / transient recorder can have one or more graphs, each displaying one or more signals, where each graph can display different parts of a signal. Graphs can display the signal(s) in Yt mode or in XY mode, with or without interpolation. Colors of all items in a graph can be set to any required value. Graph dimensions can be adjusted to any required size, graphs can be located in one single window or in separate windows, which can be located anywhere on the desktop.
Cursors are available to make on screen measurements. Signals can be given descriptive names and a legend is available to simplify identifying the displayed signals. Text labels can be placed to mark interesting parts of the signal(s).
Measurements are only limited by the availalbe memory in the computer or the available disk space. To reveal all details of the measured signals, unlimited zooming is available in both vertical and horizontal direction. All zoom actions can be undone with an undo zoom function.
Mathematical operations in the data logger
Various mathematical operations can be performed on the measured data. Basic mathematical operations that can be performed are:
- Adding/subtracting
- Multiplying/dividing
- Differentiating
- Integrating
- Determining the square root of a signal
- Determining the absolute value of a signal
These operations can be combined in any thinkable way. The result of a mathematical operation can be displayed in a graph and can also be used as input for another mathematical operation.
More complexe mathematical operations that are available are:
- Filtering
- Min/Max detection
- Limitting
- Determining duty cycle
- Resampling data
Storing data logger measurement data
Measurement data can be stored in various different ways:
- Saved to disk in various different data file formats
- Printed, with customizable layout and colours
- Stored as image file, in various common formats
- Data logger controls
Controlling the data logger / transient recorder is done through customizable toolbars, through popup menus and by hotkeys. A quick function toolbar is available for often used functions.
Multimeter
The multimeter is an instrument that performs a measurement on a signal and then determines one or more specific properties of that signal and displays these as numeric values. Displaying can be done using a numerical display or with a gauge.
The multimeter can be used to measure or monitor specific properties of a signal, like RMS value, frequency, maximum value etc. When using a gauge display, it can be very helpful when adjusting a circuit for a specific property, e.g. adjusting an offset to zero.
Features of the Multi Channel software multimeter
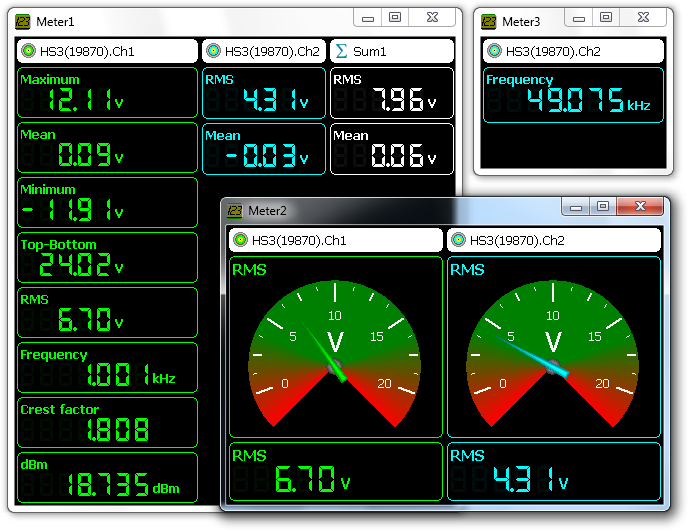
The multimeter function in the Multi Channel oscilloscope software has the following features:
- Display any number of sources. These can be signals directly from hardware instruments but also mathematical signals created by I/Os.
- Display various properties of a source:
- Maximum
- Minimum
- Top-Bottom
- Root Mean Square (RMS)
- Mean
- Variance
- Standard Deviation
- Frequency
- Crest factor
- Rise time
- Fall time
- dBm
- Total Harmonic Distortion (THD)
- Display each property in a numerical display or in a gauge
- Multiple multimeters can be opened simultanously
- Displays can be configured in many ways:
- color settings
- number of digits
- number of decimals
- auto prefix on or off (µ m k M G etc.)
Arbitrary waveform generator
An arbitrary waveform generator is an instrument that can generate repetitive or single shot signals. The signals can have a predefined standard shape like a sine wave or a square wave as in a conventional function generator. However, the signals can also have an arbitrary shape, defined by the user. These signals can be created using the Multi Channel oscilloscope software or an external program or can be signals previously measured by the oscilloscope and loaded in the generator.
A function generator is an essential instrument in testing circuits. It can be used to apply a signal to a circuit under test, to test the functionality of that circuit.
A specific application of an arbitrary waveform generator is the ability produce signals that simulate certain external conditions without the need of having the actual condition. An example of this is generating a previously measured crankshaft sensor signal and apply that to the motor management system of a car. Various parts in the motor management system can then be tested without the engine having to run. Also systems relying on serial communication signals can be tested this way.
TiePie engineering instruments that include an arbitrary waveform generator are the Handyscope HS5 and the Handyscope HS3.
Features of the Multi Channel software arbitrary waveform generator
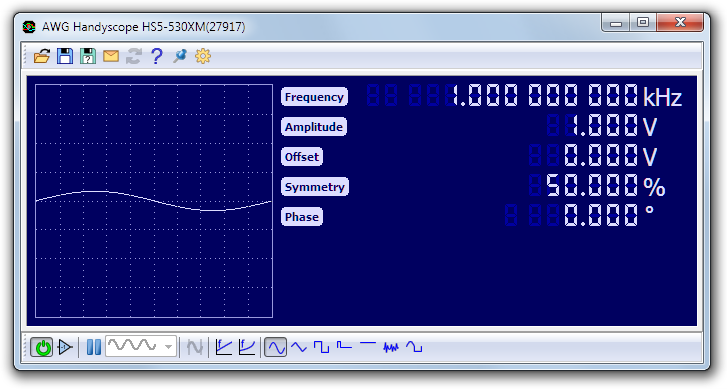
Display
The function generator features a large display showing the signal shape of the actual signal being generated.
Signal types
The arbitrary waveform generator can generate several signal types:
- Sine Sine wave
- Triangle Triangular wave
- Square Square wave
- Pulse Pulse
- DC DC
- Noise Noise
- Arbitrary Arbitrary waves
Arbitrary waves can be previously measured signals, which can be loaded from a file or can be transferred directly from the measuring instrument. These can also be signals created in an external application.
Signal properties
Depending on the selected signal type, various signal properties can be set:
- Frequency
- Amplitude
- Offset
- Symmstry
- Phase
- Width
To adjust a signal property, click the digits or scroll the mouse wheel when the mouse pointer is over a specific digit. Clicking the upper half of a digit will increase the value of that digit, while clicking the lower half of a digit decreases it. Digits that are currently off, can be enabled by clicking their upper half.
Properties can also be adjusted by clicking the label with the name of the property or pressing the corresponding hotkey. This opens a dialog in which the requested value can be entered. This dialog accepts prefixes like u, m, k, M, etc.
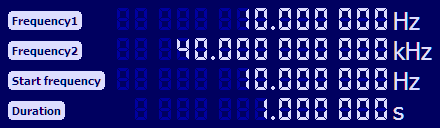
Sweep mode
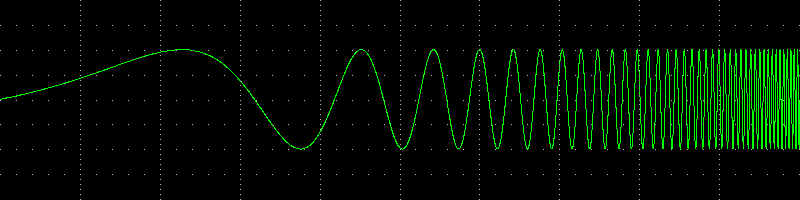
The function generator has a sweep function that allows to perform a linear Linear sweep or logarithmic Logarithmic sweep continuous sweep with the selected signal type (sine, triangle or square). Begin and end frequency of the sweep can be set, as well as an optional starting frequency between the begin and end limits. The duration of the sweep is also adjustable.
Generator mode
With the generator mode, the function generator can be set to generate continuous signals, generate in burst mode or generate in gated mode.
Continuous mode
In continuous mode, the function generator generates the selected signal continuously until stopped. Starting is done using the Start/Stop button or via an external trigger signal.
Burst mode
In burst mode, the generator generates a burst of the selected signal and then automatically stops. The burst length is set to a number of cycles of the selected signal. Each burst start will generate the selected amount of cycles of the selected signal.
For arbitrary signals, the pattern buffer can also be divided in segments, allowing to generate segments of the waveform. Each burst start will generate the next segment of the total pattern.
A burst can be started manually using the Start/Stop button or can be started by an external trigger signal (TTL).
Gated mode
In gated mode, the generator generates a signal based on the presence of an external trigger signal. Various different gated modes are available to control how the generator responds to the external signal.
Trigger output
The generator has three trigger output signals which can be used to trigger e.g. the oscilloscope:
| Trigger signal | function |
| Generator Start | is set when a signal or burst is started |
| Generator New Period | is set each time a new cycle of the signal is started |
| Generator Stop | is set when a signal or a burst is stopped |
Protocol analyzers
A protocol analyzer is a measuring instrument that analyzes one or more signals that are used to communicate between electronic devices according a specific protocol. A protocol analyzer examines the signals and decodes the information that is transferred. De decoded information can be displayed in graphs, meter sinks and table sinks.
A protocol analyzer is a useful tool when developing a hardware and/or software implementation of a communication bus. It can also be used when debugging device or bus failures.
The Multi Channel oscilloscope software contains the following protocol analyzers:
- CAN bus analyzer
- J1939 decoder
- I²C analyzer
- Serial analyzer
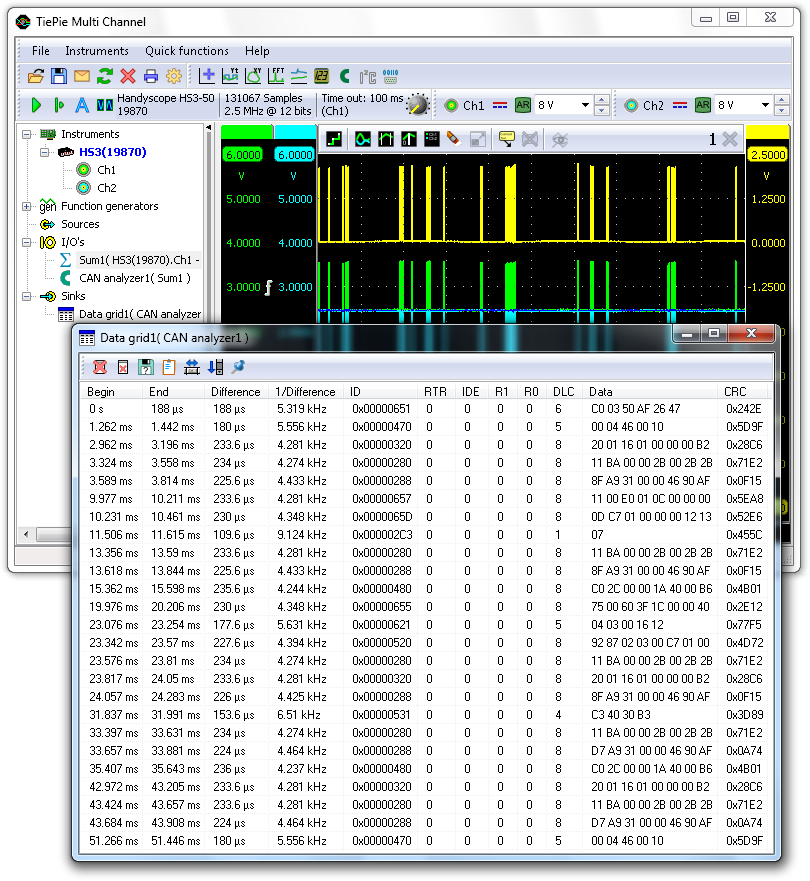
CAN analyzer
The CAN analyzer in the Multi Channel oscilloscope software can be used to decode messages which are transmitted on a CAN bus. The source for the CAN analyzer can either be the differential CAN signal or the CAN-high signal. All CAN bus bitrates are supported. Various fields from the CAN bus messages are decoded and can be displayed in a table as shown below.
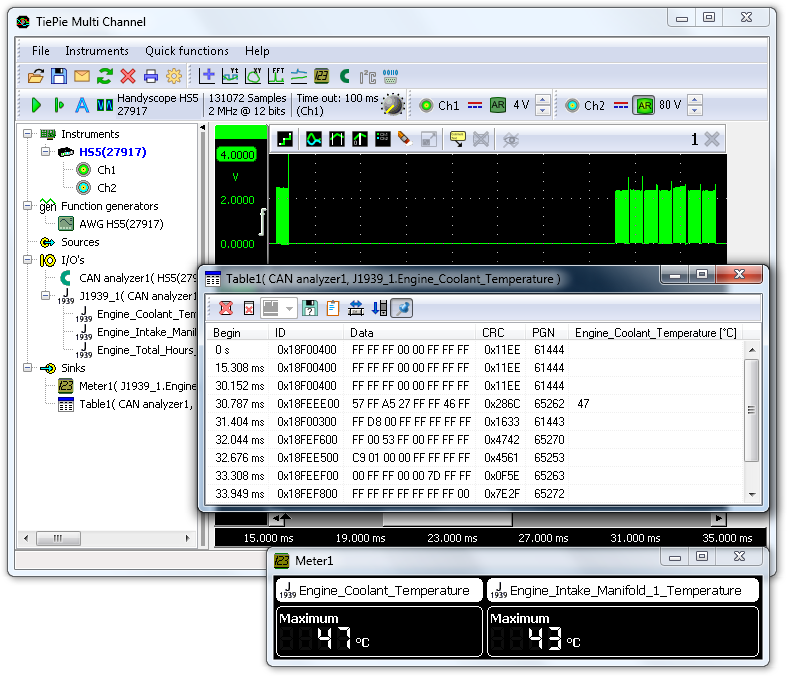
J1939 decoder
The J1939 decoder in the Multi Channel oscilloscope software extracts SAE J1939 SPN values from CAN messages. It has one input to receive CAN messages, from e.g. a CAN analyzer and can have multiple outputs. Each output contains the values of a single SPN (Suspect Parameter Number), selected from a database or loaded from a custom INI file. The data from these outputs can be used in graphs, meters, tables and by other I/Os.
I²C analyzer
The I²C analyzer in the Multi Channel oscilloscope software analyzes both I²C signals and displays the transferred messages. Besides I²C busses, it also supports related buses like SMBus, PMBus, ACCESS.bus and TWI.
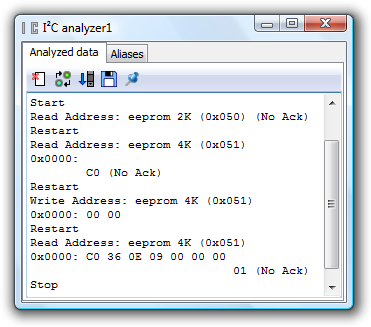
The I²C analyzer uses the SDA and SCL signals from the I²C bus and translates these into a chronological list of all instructions including their data. The I²C analyzer has the following features:
- 10 kbps, 100 kbps, 400 kbps, 1 Mbps and 3.4 Mbps support
- Missing ACK detection
- 7 and 10 bits addressing support
- Repeated start support
- Clock stretching support
- User defined alias per address for quick device recognition.
Serial analyzer
The Serial analyzer in the Multi Channel oscilloscope software analyzes one or more serial signals and displays the transferred messages. It supports RS232 serial interfaces, as well as related interfaces like RS485, MIDI, DMX and other compatible buses.
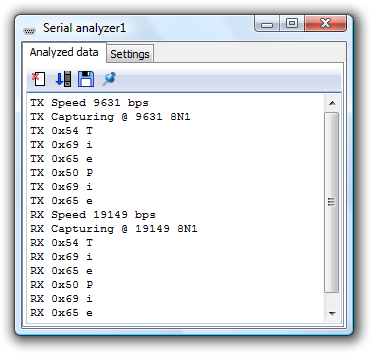
The serial analyzer can simultaneously analyze and decode multiple communication signals. It features:
- Automatic baudrate detection and user defined baudrate setting
- Databits setting: 5, 6, 7 or 8
- Parity setting: none, even, odd, mark or space
- Stopbits setting: 1 or 2.